Five Logistics Moves That Seem Backward — Until You See the Savings
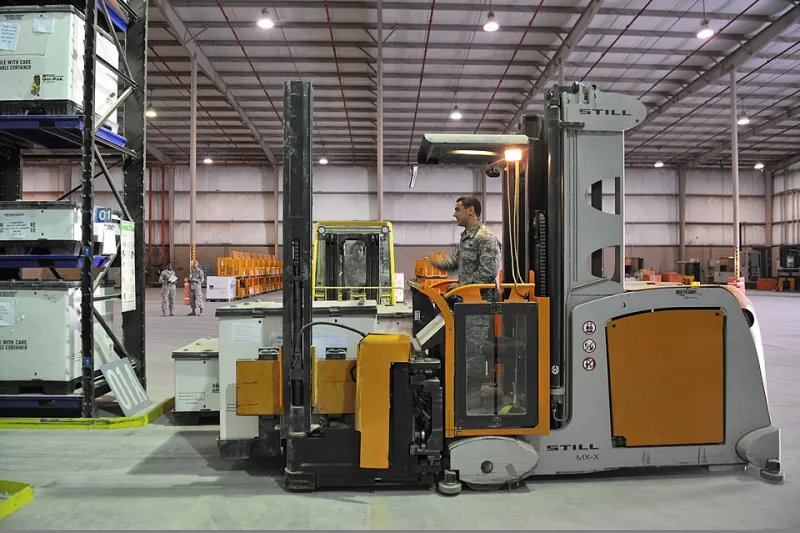
Photo: MSgt David Miller, Public domain, via Wikimedia Commons
When the Obvious Answer Is the Wrong One
Logistics optimization is a discipline that rewards contrarian thinking. The conventional playbook — consolidate shipments, negotiate lower rates, add warehouse space when inventory grows — is so widely followed that it has become a source of competitive parity rather than advantage. Organizations that follow it rarely fall behind, but they rarely pull ahead either.
The strategies outlined below are not theoretical. Each has been applied in real operational contexts across manufacturing, distribution, and retail supply chains in the United States, and each has demonstrated cost reductions in the range of 25 to 35 percent within 12 to 18 months of implementation. What makes them counterintuitive is that, on the surface, they appear to increase complexity, reduce control, or even raise certain line-item costs — while delivering substantially lower total logistics expenditure.
Strategy 1: Deliberately Reduce Your Carrier Base — Then Pay Some of Them More
The instinct to diversify across a large carrier network is understandable. More options, the thinking goes, creates negotiating leverage and reduces dependency risk. In practice, however, fragmented carrier relationships frequently produce the opposite effect.
When freight volume is spread thinly across 15 or 20 carriers, no single provider has sufficient incentive to prioritize your freight during peak capacity periods, invest in account-specific service improvements, or offer meaningful rate concessions. You become, in effect, a commodity customer to each of them.
The counterintuitive move is to consolidate to a core group of three to five strategic carriers, concentrate volume intentionally, and — critically — pay slightly above market rate on lanes where service reliability matters most. Organizations that have executed this strategy report that the premium paid on select lanes is more than offset by reductions in exception-related costs, expedited freight charges, and administrative overhead associated with managing a fragmented network.
Implementation metric: Track total cost per unit shipped — not rate per mile — before and after carrier consolidation. The difference becomes visible within two quarters.
Strategy 2: Stop Optimizing Your Fastest Route and Start Optimizing Your Most Predictable One
Route optimization technology is typically configured to minimize transit time or fuel consumption. Both are reasonable objectives. Neither is necessarily the right one.
In supply chains where manufacturing schedules, retail replenishment cycles, or customer commitments depend on delivery predictability, a route that arrives in four days with 95 percent on-time consistency outperforms a route that averages three days but delivers on time only 78 percent of the time. The variance, not the average, is where the cost lives — in the form of production stoppages, safety stock buffers, and customer service escalations.
Several mid-sized consumer goods distributors operating in the Southeast have shifted their optimization criteria from speed to schedule adherence and reduced their downstream buffer inventory by 18 percent as a direct result — a saving that substantially exceeded any efficiency gain available through faster routing.
Implementation metric: Measure delivery schedule variance by lane, not just average transit time. Redesign routing priorities around variance reduction on your highest-volume corridors.
Strategy 3: Add a Warehousing Node to Reduce Total Warehousing Cost
This is perhaps the most counterintuitive entry on this list. Conventional cost-reduction logic dictates consolidating warehouse locations to reduce fixed overhead. Adding a facility, by contrast, appears to increase cost almost by definition.
The flaw in that reasoning is that it measures facility cost in isolation rather than total network cost. In many distribution networks, particularly those serving geographically dispersed customer bases across a country as large as the United States, a strategically placed regional node reduces last-mile freight expense, transit time, and damage rates sufficiently to generate net savings that far exceed the added facility overhead.
A national industrial supplies distributor added a single cross-dock facility in the Kansas City metro area — chosen specifically for its position relative to major freight corridors — and reduced its average outbound freight cost per order by 22 percent while simultaneously improving two-day delivery coverage to customers in the central US by 31 percent.
Implementation metric: Model total landed cost per order, inclusive of freight, handling, and inventory carrying cost, across current and proposed network configurations before making any facility decision.
Strategy 4: Give Certain Vendors Less Oversight — and Negotiate Harder With the Rest
Vendor management programs are typically designed on a uniform framework: every supplier receives the same scorecard, the same review cadence, and the same contractual pressure. This approach feels equitable but is operationally inefficient.
A more effective model segments the vendor base ruthlessly. Suppliers whose performance history is consistently strong and whose product categories carry lower substitution risk are granted streamlined processes, reduced audit frequency, and faster payment terms in exchange for favorable pricing. The management bandwidth freed by reducing oversight of reliable vendors is then concentrated on the smaller group of suppliers whose performance is variable or whose categories are strategically critical.
This reallocation — fewer resources spent managing reliable partners, more leverage applied where it matters — has enabled procurement teams to achieve an average of 12 to 17 percent additional savings from their highest-risk vendor relationships without degrading overall supply chain performance.
Implementation metric: Calculate management hours invested per vendor tier against the cost and service outcomes generated. Realign resources based on where active management produces measurable return.
Strategy 5: Deliberately Allow Some Stockouts to Reduce Total Inventory Cost
This strategy requires careful framing, because it is easily misread as an endorsement of poor service. It is not. Rather, it is a recognition that zero-stockout targets — common in risk-averse logistics cultures — are frequently achieved at an inventory carrying cost that far exceeds the revenue value of the sales they protect.
Not all products carry equal margin, equal demand velocity, or equal substitution sensitivity. A rigorous SKU-level analysis almost always reveals a subset of items for which the cost of maintaining continuous availability — in safety stock, warehouse space, and working capital — substantially exceeds the margin impact of an occasional stockout event, particularly when customers can be offered acceptable substitutes.
Retailers and distributors that have applied demand-segmented service-level targets — accepting lower fill rates on low-margin, low-velocity items while maintaining high availability on core revenue drivers — have reduced total inventory carrying costs by an average of 19 percent with no measurable impact on overall customer satisfaction scores.
Implementation metric: Assign service-level targets at the SKU level based on margin contribution and demand pattern. Review quarterly and adjust as product mix evolves.
The Common Thread: Precision Over Convention
Each of these strategies shares a foundational characteristic: they replace broad, intuitive rules with precise, data-grounded decisions. The logistics industry has long rewarded consistency and risk aversion — values that served well in more stable operating environments. In today's cost-pressured, capacity-constrained landscape, however, the organizations gaining ground are those willing to question inherited assumptions and measure outcomes at a granular level.
At Hailang Logistics & Management, our operating philosophy is built on exactly this discipline. Precision. Strategy. Results. The savings are available — but only to those willing to look past the conventional answer.
